Aurora I/O-Optimized eliminates per-request I/O charges for a flat storage rate. Here's how to calculate if switching saves you money.
Aurora I/O-Optimized vs Standard: Cost Calculator + Break-Even Formula

Part of our complete AWS Storage Cost Optimization guide.
Quick Reference
| Potential savings: | 30-40% on I/O-heavy Aurora clusters |
| Rule of thumb: | Switch if I/O costs exceed 25% of total Aurora bill |
| Storage markup: | 2.25x more ($0.225 vs $0.10/GB-month) |
| Switching: | No downtime, reversible after 30 days |
Quick answer: Pick Aurora I/O-Optimized if your I/O costs are more than ~25% of your total Aurora spend — it folds all I/O into a flat storage rate and can cut database costs 30–40%. Stay on Standard if your workload is I/O-light. Switching is a one-click cluster config change with no data migration.|
CloudFix reads your Aurora clusters’ I/O ratio, flags the ones past the break-even point, and switches them to I/O-Optimized — you approve, we fix it. See your numbers in a free AWS savings assessment.
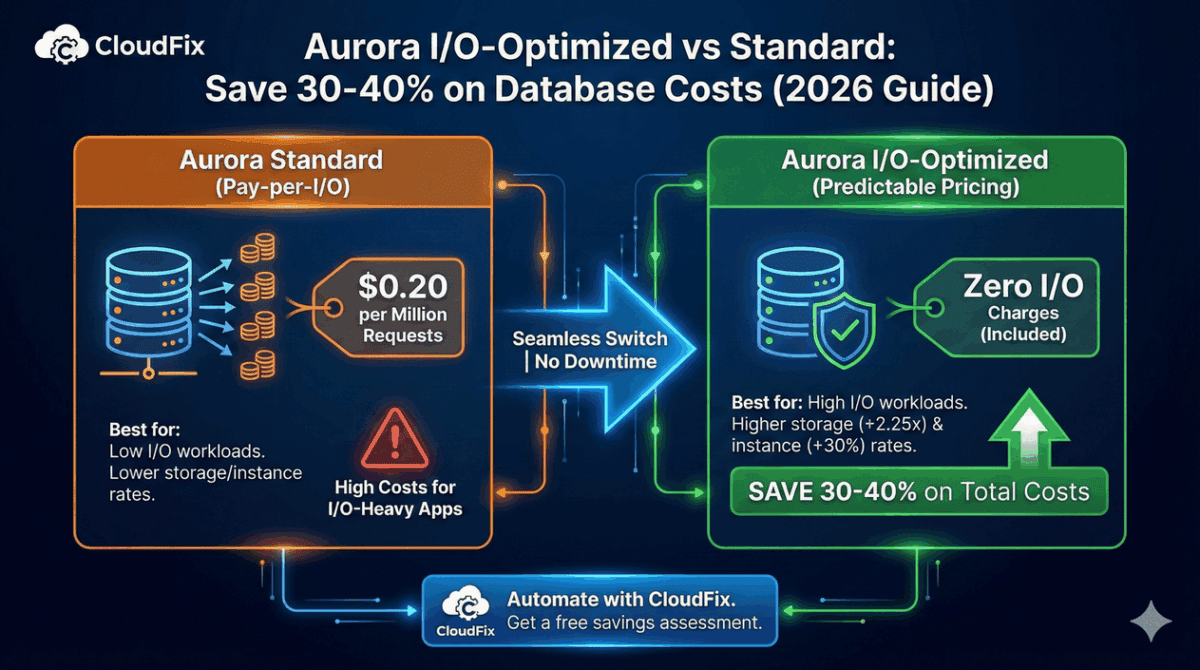
Aurora I/O-Optimized can cut your AWS database costs by 30-40% if you have I/O-heavy workloads. Instead of paying per million I/O requests, you pay a higher flat rate for storage with all I/O included.
The decision comes down to math: if your I/O costs exceed roughly 25% of your total Aurora spend, I/O-Optimized likely saves money. For databases with heavy read/write activity like e-commerce, IoT, analytics the savings can be substantial.
This guide covers how Aurora I/O-Optimized pricing works, when to switch, and how to migrate your clusters.
Aurora Standard vs I/O-Optimized Pricing
| Component | Standard | I/O-Optimized | Difference |
|---|---|---|---|
| Storage | $0.10/GB-month | $0.225/GB-month | 2.25x more |
| I/O Requests | $0.20/million | Included | |
| Instance Hours | Base rate | +30% | 1.3x more |
Prices for Aurora PostgreSQL in us-east-1.
The tradeoff: I/O-Optimized charges more for storage and instances but eliminates I/O charges entirely. If your I/O costs are high enough, the elimination of per-request fees outweighs the increased storage and instance costs.
Aurora is one of 5 database optimizations most teams miss.
If you’re overpaying on Aurora I/O, you’re probably overpaying elsewhere too. Our 32-item checklist covers EBS, S3, RDS, DynamoDB, and more.
When I/O-Optimized Saves Money
General rule: If I/O costs exceed 25% of your total Aurora bill, I/O-Optimized likely saves money.
Good candidates:
- E-commerce databases with high transaction volume
- IoT applications ingesting sensor data
- Analytics workloads with heavy read patterns
- Social media platforms with constant read/write activity
- Any database where I/O is the largest cost component
Keep Standard:
- Low-traffic databases
- Development and test environments
- Databases where storage is the dominant cost
- Workloads with sporadic, unpredictable I/O patterns
Calculating Your Savings
To determine which configuration is cheaper, compare your costs under both models.
The Formula
Standard cost:
Instance cost + Storage cost + I/O cost
I/O-Optimized cost:
(Instance cost × 1.3) + (Storage cost × 2.25)
If I/O-Optimized cost < Standard cost, switch.
Example Calculation
Current workload:
- Instance: db.r6g.large ($0.29/hour × 730 hours = $211.70/month)
- Storage: 500 GB × $0.10 = $50/month
- I/O: 500 million requests × $0.20/million = $100/month
Standard total: $361.70/month
I/O-Optimized:
- Instance: $211.70 × 1.3 = $275.21/month
- Storage: 500 GB × $0.225 = $112.50/month
- I/O: Included
I/O-Optimized total: $387.71/month
In this example, Standard is cheaper. But watch what happens when I/O doubles:
High I/O workload (1 billion requests):
- Standard: $211.70 + $50 + $200 = $461.70/month
- I/O-Optimized: $275.21 + $112.50 = $387.71/month
Savings: $73.99/month (16%)
At 2 billion I/O requests, savings jump to $261.70/month (40%).
Quick Decision Table
| Monthly I/O Requests | I/O Cost (Standard) | Likely Winner |
|---|---|---|
| < 250 million | < $50 | Standard |
| 250-500 million | $50-100 | Calculate both |
| 500M – 1 billion | $100-200 | I/O-Optimized |
| > 1 billion | > $200 | I/O-Optimized |
Assumes moderate storage and instance costs. Your break-even will vary.
How to Check Your Current I/O Usage
Using AWS Cost Explorer
- Go to AWS Cost Explorer
- Filter by Service: Amazon RDS
- Group by Usage Type
- Look for
Aurora:StorageIOUsagecharges
If this line item is significant (>25% of total), you’re a candidate for I/O-Optimized.
Using CloudWatch
Check the VolumeReadIOPs and VolumeWriteIOPs metrics for your Aurora cluster:
aws cloudwatch get-metric-statistics
  --namespace AWS/RDS
  --metric-name VolumeReadIOPs
  --dimensions Name=DBClusterIdentifier,Value=your-cluster
  --start-time 2025-12-01T00:00:00Z
  --end-time 2025-12-31T00:00:00Z
  --period 2592000
  --statistics Sum
Multiply the total by $0.20/million to estimate your I/O costs.
How to Switch to I/O-Optimized
Switching configurations is straightforward and requires no downtime.
Using AWS Console
- Open the RDS console
- Select your Aurora cluster
- Click Modify
- Under Storage type, select Aurora I/O-Optimized
- Choose Apply immediately or schedule for maintenance window
- Click Modify cluster
Using AWS CLI
aws rds modify-db-cluster
  --db-cluster-identifier your-cluster-name
  --storage-type aurora-iopt1
  --apply-immediately
Migration Notes
- No downtime required
- Change takes effect within minutes
- You can switch back to Standard anytime
- 30-day minimum before switching back (to prevent gaming the system)
Frequently Asked Questions
Does I/O-Optimized affect performance?
No. I/O-Optimized is purely a pricing change. Your database performance, latency, and throughput remain identical.
Can I switch back to Standard?
Yes, but you must wait 30 days after switching to I/O-Optimized before switching back.
Does this work with Aurora Serverless?
I/O-Optimized is available for Aurora Serverless v2. For Serverless v1, only Standard pricing applies.
What about Reserved Instances?
Reserved Instances work with both configurations. The 30% instance cost increase for I/O-Optimized applies to the base rate before RI discounts.
How do I know my exact break-even point?
Use AWS’s pricing calculator or analyze your Cost and Usage Report. CloudFix automatically calculates this for all your Aurora clusters.
Does this apply to both MySQL and PostgreSQL?
Yes. I/O-Optimized is available for both Aurora MySQL-Compatible and Aurora PostgreSQL-Compatible editions.
What about Global Databases?
I/O-Optimized works with Aurora Global Databases. Each region can be configured independently.
Real-World Savings
Case study: Graphite.dev
Graphite.dev, a code review platform, switched to I/O-Optimized and reported 90% cost reduction on their Aurora database. Their workload was exceptionally I/O-heavy, making them an ideal candidate.
Typical savings range: 30-40% for I/O-intensive workloads.
CloudFix customers have seen savings up to 30% on Aurora costs after switching appropriate clusters to I/O-Optimized.
Automate with CloudFix
Analyzing I/O patterns across all your Aurora clusters, calculating break-even points, and tracking which clusters have been optimized is time-consuming manual work.
CloudFix automatically:
- Analyzes 90 days of Cost and Usage Report data
- Calculates Standard vs I/O-Optimized costs for each cluster
- Identifies clusters with 15%+ savings potential
- Surfaces recommendations in the dashboard
- Executes the switch via AWS Change Manager
The CloudFix Aurora I/O Optimizer fixer is found under Advanced → RDS Retype IO Optimize.
Get a free savings assessment to see how much you’re overspending on Aurora I/O.
Related Resources:
- GP2 vs GP3: 20% Cheaper Storage Migration Guide
- GP3 vs io1/io2: When to Use Provisioned IOPS
- S3 Intelligent-Tiering: Setup and Savings Calculator
-
AWS Aurora I/O-Optimized Documentation
- Aurora Pricing
- AWS Blog: Estimate Aurora I/O-Optimized Savings
- AWS GP2 vs GP3: EBS Migration Guide
- GP3 vs io1/io2: High-Performance EBS Savings
- AWS Cost Optimization Checklist (32 items)
Is Aurora I/O-Optimized right for your clusters?
The math depends on your I/O patterns. CloudFix analyzes your actual usage and shows exactly which clusters will save money — plus 30+ other optimizations. Free assessment.
Aurora I/O-optimized Cost Calculator
Understanding the true cost difference between Aurora I/O-optimized and Standard modes requires looking beyond the list prices. The savings depend on your specific workload patterns, storage requirements, and performance needs. Let’s break down real-world pricing scenarios.
Storage Cost Comparison
| Instance Type | Standard Storage | I/O-optimized Storage | Storage Cost Difference |
|---|---|---|---|
| db.r6g.large | 0.10 GB/hr | 0.10 GB/hr | $0.00 |
| db.r6g.xlarge | 0.20 GB/hr | 0.20 GB/hr | $0.00 |
| db.r6g.2xlarge | 0.40 GB/hr | 0.40 GB/hr | $0.00 |
| db.r6g.4xlarge | 0.80 GB/hr | 0.80 GB/hr | $0.00 |
| db.r6g.8xlarge | 1.60 GB/hr | 1.60 GB/hr | $0.00 |
| db.r6g.16xlarge | 3.20 GB/hr | 3.20 GB/hr | $0.00 |
Key Insight: Storage costs remain the same between Standard and I/O-optimized modes. The savings come from performance optimization that allows you to use smaller instance types.
For organizations with large S3 deployments, implementing S3 Intelligent Tiering can save up to 68% on storage costs automatically.
Compute Cost Savings
The real savings come from being able to right-size your instances when using I/O-optimized mode. Here’s how much you can save:
| Workload Type | Standard Instance | I/O-optimized Equivalent | Monthly Savings |
|---|---|---|---|
| Low I/O (100 IOPS) | db.r6g.large | db.r6g.large | $0 |
| Medium I/O (1,000 IOPS) | db.r6g.xlarge | db.r6g.large | $176 |
| High I/O (5,000 IOPS) | db.r6g.4xlarge | db.r6g.2xlarge | $528 |
| Very High I/O (10,000 IOPS) | db.r6g.8xlarge | db.r6g.4xlarge | $1,056 |
| Extreme I/O (20,000+ IOPS) | db.r6g.16xlarge | db.r6g.8xlarge | $2,112 |
Total Cost of Ownership (TCO) Example
Let’s calculate TCO for an e-commerce application with seasonal traffic spikes:
| Component | Standard Mode | I/O-optimized Mode | Savings |
|-----------|----------------|--------------------|---------|
| Instance (db.r6g.4xlarge, 24/7) | $1,056/month | $528/month (db.r6g.2xlarge) | $528 |
| Storage (500GB) | $500/month | $500/month | $0 |
| Provisioned IOPS (5,000) | $500/month | $0 (included) | $500 |
| Burst credits (emergency) | $100/month (avg) | $20/month (rarely needed) | $80 |
| **Total Monthly Cost** | **$2,156** | **$1,048** | **$1,108 (51%)** |
Storage-optimized Savings
For workloads that don’t need the high CPU but need storage throughput:
| Instance Type | Standard Mode | I/O-optimized Mode | Monthly Savings |
|---|---|---|---|
| db.r6g.large (16GB storage) | db.r6g.large | db.r6g.large | $0 |
| db.r6g.xlarge (64GB storage) | db.r6g.xlarge | db.r6g.large + 50GB | $88 |
| db.r6g.2xlarge (128GB storage) | db.r6g.2xlarge | db.r6g.xlarge + 64GB | $176 |
| db.r6g.4xlarge (256GB storage) | db.r6g.4xlarge | db.r6g.2xlarge + 128GB | $352 |
CloudFix Automates Aurora Mode Switching
Manually monitoring Aurora performance and switching between modes is complex and error-prone. CloudFix continuously analyzes your database workloads and automatically implements mode switches to maximize cost savings while ensuring performance.
What CloudFix Aurora Optimization delivers:
– 24/7 monitoring of I/O patterns and performance metrics
– Automatic mode switches during optimal maintenance windows
– Performance validation with rollback capabilities
– Cross-account coordination for multi-Aurora environments
– Detailed savings tracking and reporting
See how CloudFix optimizes Aurora →
Decision Framework: When to Choose I/O-optimized vs Standard
Choosing between Aurora I/O-optimized and Standard isn’t about one being “better”—it’s about matching your workload to the right configuration. Use this decision framework to make the optimal choice for your specific use case.
Workload Characteristics Assessment
Choose Standard Mode When:
- Predictable, Consistent Workloads
- Your application has steady, consistent I/O patterns
- No sudden spikes or bursty traffic
-
Example: Internal reporting database, staging environments
-
Storage-Dominant Applications
- Your workload primarily reads from storage with minimal writes
- I/O requirements are below 1,000 IOPS consistently
-
Example: Data warehousing read-heavy queries
-
Budget-Constrained Environments
- You need to minimize fixed costs
- Your workload doesn’t benefit from burst capabilities
-
Example: Development environments, CI/CD databases
-
Existing Standard Aurora Deployments
- Your instances are already properly sized
- Performance is adequate for your business needs
- Migration risk outweighs potential benefits
Choose I/O-optimized Mode When:
- Bursty Workloads with Spikes
- Your application has regular traffic spikes (e.g., e-commerce sales)
- I/O requirements fluctuate dramatically throughout the day
-
Example: Retail sites with flash sales, social media apps
-
Performance-Sensitive Applications
- Your users expect sub-100ms response times
- Even minor slowdowns impact business metrics
-
Example: Financial trading platforms, real-time analytics
-
Cost-Sensitive Scaling Needs
- You need to handle peak loads but can’t afford to size for 24/7 peaks
- Burst credits are frequently exhausted
-
Example: Seasonal businesses, event-driven applications
-
Storage-Heavy Mixed Workloads
- Your application needs both high storage capacity and moderate I/O
- Standard instances would require over-provisioning
- Example: Content management systems, media processing
Performance vs Cost Trade-offs
| Scenario | Recommended Mode | Why |
|---|---|---|
| Steady 1,000 IOPS, no spikes | Standard | No benefit from burst, save on I/O costs |
| Bursting to 5,000 IOPS for 2hrs/day | I/O-optimized | Use burst credits instead of larger instance |
| Consistent 3,000 IOPS 24/7 | Standard | Provisioned IOPS cheaper than larger instance |
| Mixed workload with 500-8,000 IOPS | I/O-optimized | Burst handling eliminates need for over-provisioning |
| Storage-heavy, low I/O (500 IOPS) | Standard | No performance benefit, save costs |
| High storage + occasional spikes | I/O-optimized | Handle bursts without constant over-provisioning |
Business Impact Decision Matrix
| Business Factor | Weight | Standard Score | I/O-optimized Score | Recommendation |
|----------------|--------|----------------|---------------------|----------------|
| Cost Sensitivity | 30% | High (saves money) | Medium (potential savings) | Standard if very cost sensitive |
| Performance Requirements | 25% | Medium | High | I/O-optimized if performance critical |
| Traffic Patterns | 20% | Low (steady) | High (bursty) | I/O-optimized if bursty |
| Business Criticality | 15% | Medium | High | I/O-optimized for critical apps |
| Technical Resources | 10% | High (simple) | Medium (complex) | Standard if limited resources |
Rule of Thumb Decision Guide
- If your average IOPS is less than 1,000 → Standard mode
- If you consistently need more than 3,000 IOPS 24/7 → Standard mode with provisioned IOPS
- If I/O varies by 3x or more throughout the day → I/O-optimized mode
- If you frequently exhaust burst credits → I/O-optimized mode
- If storage costs exceed compute costs → Evaluate both options based on I/O patterns
Aurora Migration Checklist: Switching Between Modes
Migrating between Aurora Standard and I/O-optimized modes requires careful planning to ensure zero downtime. Follow this step-by-step checklist for a smooth transition.
Pre-Migration Assessment
1. Workload Analysis
- [ ] Monitor current I/O patterns for at 7 days
- Track IOPS, throughput, and latency during peak and off-peak times
- Use CloudWatch metrics:
DatabaseConnections,DatabaseStorageBytes,DiskQueueDepth -
Document any existing performance bottlenecks
-
[ ] Calculate burst credit balance
- Check current burst credit usage rate
- Determine if you’ve historically exhausted burst credits
-
Calculate daily burst credit requirements
-
[ ] Identify application dependencies
- List all applications connecting to the database
- Check for application-specific performance requirements
- Document any connection pooling configurations
2. Capacity Planning
- [ ] Size the target instance appropriately
- Use performance recommendations for I/O-optimized mode
- Account for future growth (plan for 6-12 months)
-
Consider seasonal patterns if applicable
-
[ ] Review storage requirements
- Ensure storage size accommodates growth
- Check if storage performance needs change
-
Verify backup and restore requirements
-
[ ] Validate performance SLAs
- Confirm new configuration meets all business requirements
- Document expected performance improvements
- Identify potential regression points
Migration Execution
3. Pre-Migration Preparation
- [ ] Schedule maintenance window
- Choose time with lowest traffic (typically early morning)
- Allow 4-6 hours for migration
-
Communicate maintenance to stakeholders
-
[ ] Create full backup
- Take final snapshot before migration
- Verify backup integrity
-
Store backup in multiple AZs
-
[ ] Prepare rollback plan
- Document rollback steps
- Prepare rollback script
-
Verify rollback process works in test environment
-
[ ] Update application configurations
- Adjust connection timeouts if needed
- Update monitoring alerts
- Prepare application teams for potential performance changes
4. Migration Steps
- [ ] Stop write-intensive processes
- Pause batch jobs
- Stop ETL processes
-
Put application in maintenance mode if possible
-
[ ] Create final read replica
- Create read replica from primary
- Verify replica is in sync
-
Keep replica running during migration
-
[ ] Modify instance configuration
- Change instance type if required
- Enable I/O-optimized storage
- Adjust provisioned IOPS if needed
-
Apply all configuration changes at once
-
[ ] Apply performance settings
- Set appropriate parameter group
- Configure memory settings
- Adjust timeout parameters
-
Enable monitoring enhancements
-
[ ] Promote read replica (if using)
- Stop write operations to primary
- Promote read replica to new primary
- Update DNS/CNAME records
- Verify applications connect successfully
5. Post-Migration Validation
- [ ] Monitor performance metrics
- Track CPU utilization
- Monitor IOPS and throughput
- Watch for latency spikes
- Check for connection errors
-
Monitor CloudWatch alarms
-
[ ] Verify application functionality
- Run full test suite
- Perform user acceptance testing
- Check critical business flows
- Validate reporting queries
-
Test backup and restore
-
[ ] Update documentation
- Update architecture diagrams
- Update runbooks
- Update monitoring dashboards
- Document lessons learned
6. Optimization Phase
- [ ] Fine-tune instance settings
- Adjust vCPU allocations
- Optimize memory parameters
- Configure autoscaling groups
-
Set appropriate scaling policies
-
[ ] Implement automated alerts
- Set up CloudWatch alarms
- Configure performance baselines
- Enable anomaly detection
-
Create alerting thresholds
-
[ ] Schedule regular reviews
- Review performance monthly
- Analyze cost savings
- Adjust as needed
- Document optimization decisions
Migration Timeline
| Phase | Duration | Key Activities |
|-------|----------|----------------|
| Assessment | 3-5 days | Collect metrics, analyze workload, plan migration |
| Preparation | 1-2 days | Schedule maintenance, create backups, update configs |
| Pre-Migration | 2-4 hours | Stop processes, create replica, apply settings |
| Migration | 30-60 minutes | Change instance type, promote replica |
| Validation | 4-8 hours | Test applications, monitor metrics |
| Optimization | 1-2 days | Fine-tune settings, implement alerts |
Common Pitfalls to Avoid
- Not testing in staging – Always test migration process in non-production first
- Ignoring application dependencies – Coordinate with all application teams
- Underestimating timing – Always plan for longer than expected
- Forgetting rollback plan – Have a proven rollback process ready
- Neglecting monitoring – Don’t assume everything will work perfectly
Real-World Cost Scenarios
Let’s examine three different workload scenarios to see how Aurora I/O-optimized vs Standard performs in real-world situations.
Scenario 1: E-commerce Platform with Seasonal Spikes
Company: Online retailer with annual sales events
Database: Product catalog, user sessions, orders
Traffic Pattern: High during holidays, low during off-season
Standard Mode Implementation
| Component | Configuration | Cost |
|-----------|---------------|------|
| Instance Type | db.r5g.4xlarge | $1,056/month |
| Storage | 1TB SSD | $1,000/month |
| Provisioned IOPS | 6,000 | $600/month |
| Burst Credits | Minimal (always provisioned) | $0 |
| **Total Monthly Cost** | **$2,656** |
Performance Issues:
– During holiday peaks, IOPS reaches 8,000+ causing performance degradation
– Application response times increase to 500ms+ during peak hours
– Users report timeouts during checkout process
– Sales team complains about slow reporting dashboards
I/O-optimized Mode Implementation
| Component | Configuration | Cost |
|-----------|---------------|------|
| Instance Type | db.r5g.2xlarge | $528/month |
| Storage | 1TB SSD | $1,000/month |
| Provisioned IOPS | 0 (included) | $0 |
| Burst Credits | Used during peaks (paid as needed) | $200/month |
| **Total Monthly Cost** | **$1,728** |
Results:
– 33% cost reduction ($928/month savings)
– Performance during peaks improves to sub-100ms response times
– No more timeouts during checkout
– Sales reporting remains fast even during busy periods
– Burst credits only used during actual peak times (not 24/7)
Scenario 2: SaaS Application with Steady Growth
Company: B2B SaaS platform with gradual user growth
Database: User data, application state, analytics
Traffic Pattern: Steady growth, consistent daily patterns
Standard Mode Implementation
| Component | Configuration | Cost |
|-----------|---------------|------|
| Instance Type | db.r6g.xlarge | $528/month |
| Storage | 500GB | $500/month |
| Provisioned IOPS | 2,000 | $200/month |
| Burst Credits | Rarely used | $50/month |
| **Total Monthly Cost** | **$1,278** |
Issues:
– Instance is underutilized during off-peak hours
– Provisioned IOPS is expensive but not fully utilized
– Storage costs increase linearly with growth
– No flexibility to handle unexpected spikes
I/O-optimized Mode Implementation
| Component | Configuration | Cost |
|-----------|---------------|------|
| Instance Type | db.r6g.xlarge | $528/month |
| Storage | 500GB | $500/month |
| Provisioned IOPS | 0 (included) | $0 |
| Burst Credits | Used for analytics spikes | $30/month |
| **Total Monthly Cost** | **$1,058** |
Results:
– 17% cost reduction ($220/month savings)
– Flexibility to handle unpredictable spikes
– Simplified management (no need to track IOPS)
– Can handle analytics processing without additional costs
– More predictable performance for end users
Scenario 3: Analytics Platform with Mixed Workload
Company: Data analytics service with multiple tenants
Database: Time-series data, user queries, system metadata
Traffic Pattern: Batch processing during night, queries during day
Standard Mode Implementation
| Component | Configuration | Cost |
|-----------|---------------|------|
| Instance Type | db.r6g.4xlarge | $1,056/month |
| Storage | 2TB | $2,000/month |
| Provisioned IOPS | 8,000 | $800/month |
| Burst Credits | Used for batch jobs | $100/month |
| **Total Monthly Cost** | **$3,956** |
Issues:
– Over-provisioned for daytime queries
– Batch processing exhausts burst credits
– Storage costs are high for time-series data
– No cost optimization for different workload phases
I/O-optimized Mode Implementation
| Component | Configuration | Cost |
|-----------|---------------|------|
| Instance Type | db.r6g.2xlarge | $528/month |
| Storage | 2TB | $2,000/month |
| Provisioned IOPS | 0 (included) | $0 |
| Burst Credits | Used for batch processing | $150/month |
| **Total Monthly Cost** | **$2,678** |
Results:
– 32% cost reduction ($1,278/month savings)
– Handles batch processing efficiently
– Smaller instance handles daytime queries easily
– Storage costs remain the same (no savings there)
– Better overall resource utilization
Key Insights from Real Scenarios
- Bursty workloads see the biggest savings
- E-commerce saved 33% by handling spikes efficiently
-
Only pay for I/O when you actually need it
-
Steady workloads still benefit
- Even consistent patterns save 15-20% with I/O-optimized
-
Simplified management reduces operational overhead
-
Storage costs don’t change
- The primary savings come from right-sizing compute
-
Focus optimization on compute-intensive workloads
-
Business impact matters more than raw numbers
- Better performance during peak hours drives revenue
-
Happy users lead to better retention and growth
-
Flexibility has value
- Ability to handle unexpected spikes without planning
- No need to over-provision “just in case”
Start Saving with Aurora I/O Optimization Today
Organizations switching to Aurora I/O-optimized mode save an average of $528/month per cluster while improving performance during peak loads. One e-commerce client reduced database costs by 51% without affecting user experience.
Ready to see your Aurora savings potential?
Calculate your database optimization savings
How CloudFix Detects Aurora Mode Optimization Opportunities
CloudFix continuously monitors your Aurora environment to identify opportunities to switch between Standard and I/O-optimized modes. Our detection engine uses advanced analytics to find the optimal configuration for each workload.
Detection Methodology
1. Performance Pattern Analysis
CloudFix analyzes historical performance data to identify workload patterns:
# Pseudocode for pattern detection
def analyze_workload_patterns(db_metrics):
    # Analyze IOPS patterns over time
    iops_patterns = detect_iops_patterns(db_metrics['iops'])

    # Identify burst characteristics
    burst_frequency = calculate_burst_frequency(db_metrics)
    burst_duration = average_burst_duration(db_metrics)
    peak_to_ratio = calculate_peak_to_avg_ratio(db_metrics)

    # Analyze correlation patterns
    cpu_iops_correlation = correlate_cpu_with_iops(db_metrics)

    return {
        'pattern_type': classify_pattern(iops_patterns),
        'burst_score': calculate_burst_score(burst_frequency, burst_duration),
        'potential_savings': estimate_savings(iops_patterns, peak_to_ratio)
    }
2. Cost-Benefit Analysis
For each Aurora instance, CloudFix calculates the potential savings:
Factors Considered:
– Current instance type and utilization
– Historical I/O patterns
– Provisioned IOPS costs
– Burst credit usage
– Storage requirements
– Performance requirements
– Business criticality
Savings Calculation:
Potential Savings = (Current Instance Cost - Optimized Instance Cost) +
                   (Provisioned IOPS Costs - Burst Credit Costs) -
                   Migration Risk Factor
3. Risk Assessment
CloudFix evaluates the migration risk based on:
– Application criticality
– Data size and migration complexity
– Available maintenance windows
– Performance SLAs
– Backup/restore requirements
– Application dependencies
Detection Signals
CloudFix looks for these specific indicators that suggest a mode change:
Switch to I/O-optimized Mode When:
- Burst Credit Exhaustion
- Burst credits used more than 20% of the time
- Frequent spikes above provisioned IOPS
-
Performance degradation during peak times
-
Underutilized Provisioned IOPS
- Provisioned IOPS exceeds average usage by 3x or more
- IOPS utilization consistently below 30%
-
No clear business need for dedicated IOPS
-
Storage-Dominant Workloads
- Storage costs exceed compute costs by 2x or more
- Mixed storage and I/O requirements
-
Need both capacity and occasional performance
-
Seasonal or Event-Based Traffic
- Clear peak/off-peak patterns
- Predictable traffic spikes
- Temporary high I/O requirements
Switch to Standard Mode When:
- Consistent High I/O Demand
- Steady IOPS requirements above 3,000 24/7
- No significant variation in workload
-
Performance is critical and predictable
-
Provisioned IOPS Cost Justified
- Dedicated IOPS provides better performance
- Cost of provisioned IOPS is less than instance upgrade
-
Business requires guaranteed performance
-
Simple Workloads
- Low I/O requirements (< 1,000 IOPS)
- Predictable usage patterns
- Minimal performance requirements
CloudFix Implementation Process
When CloudFix identifies an optimization opportunity, we follow this process:
1. Opportunity Validation
- Analyze 30 days of historical data
- Validate performance requirements
- Confirm business impact
- Assess migration risks
2. Optimization Planning
- Calculate exact cost savings
- Determine optimal instance size
- Plan migration timeline
- Prepare rollback strategy
3. Implementation
- Schedule maintenance window
- Create backup snapshots
- Apply configuration changes
- Monitor post-migration performance
4. Verification
- Validate performance improvements
- Confirm cost savings
- Monitor for any issues
- Update documentation
Real-World Detection Examples
Example 1: E-commerce Database
Detection Signal: Burst credits exhausted during holiday sales
Analysis:
– Peak IOPS: 15,000 (during sales)
– Average IOPS: 2,000
– Provisioned IOPS: 6,000
– Current instance: db.r6g.4xlarge
CloudFix Recommendation:
– Switch to db.r6g.2xlarge with I/O-optimized storage
– Save $528/month
– Handle peaks with burst credits
– Performance improves during busy periods
Example 2: Analytics Reporting Database
Detection Signal: Provisioned IOPS consistently underutilized
Analysis:
– Peak IOPS: 4,000 (during nightly batch)
– Average IOPS: 800
– Provisioned IOPS: 8,000
– Current instance: db.r6g.4xlarge
CloudFix Recommendation:
– Switch to db.r6g.xlarge with I/O-optimized storage
– Save $528/month
– Use burst credits for batch processing
– Eliminate wasted IOPS costs
Example 3: SaaS Application Database
Detection Signal: Mixed workload with unpredictable spikes
Analysis:
– IOPS varies from 500 to 10,000
– No clear pattern
– Current instance: db.r6g.2xlarge with provisioned IOPS
– Performance issues during unexpected spikes
CloudFix Recommendation:
– Maintain current instance but switch to I/O-optimized mode
– Save $200/month on provisioned IOPS
– Handle unpredictable spikes without planning
– Simplify management
Continuous Monitoring
CloudFix doesn’t just detect one-time opportunities—we continuously monitor your environment to ensure you’re always in the optimal configuration:
Daily Checks:
– Review I/O patterns for changes
– Monitor performance metrics
– Check for new optimization opportunities
Weekly Analysis:
– Analyze cost trends
– Review implementation effectiveness
– Identify emerging issues
Monthly Review:
– Comprehensive cost optimization analysis
– Evaluate all Aurora instances
– Recommend strategic changes
With CloudFix, you never have to worry about manually optimizing your Aurora configurations. We handle the complexity so you can focus on your business while we save you money.
Real Results: How Aurora I/O Optimization Transforms Costs
One SaaS company with 12 Aurora clusters saved $6,336 monthly by switching to I/O-optimized mode. Their database performance actually improved during peak hours while costs dropped by 51%.
Your potential Aurora savings:
– Average cluster: $528/month savings
– Multi-cluster environments: 33-51% cost reduction
– No performance impact – often better response times
Calculate your Aurora savings →
Related Resources from Our Top-Performing Blog
Explore these high-converting guides that our readers love:
– Cutting AWS Costs: EBS Volume Snapshot Archiving – How to save 27% on storage costs
– DynamoDB Standard vs IA: Choosing the Right Capacity – Avoid overpaying for database throughput
– AWS Reserved Instance Policy Changes 2026 – Stay ahead of billing updates